For videos on plotting points and graphing linear equations please see:
https://helpyourmath.com/immersion/elementary-algebra-chapters/chapter3
Note. The videos at the above link were made by my colleagues at BMCC CUNY.
Plotting Points
Suppose we are interested in how a child’s weight changes as they grow. As time passes we could record the child’s weight. Our data might look like this.
| Age (in months) | Weight in kg |
|---|---|
| 2 | 4.0 |
| 4 | 6.0 |
| 6 | 7.0 |
| 8 | 8.0 |
We can geometrically represent this data as points $(x, y)$ where $x = $ the child’s age and $y = $ that child’s weight when their age is $x$.
For the above data, we get four data points: $(2, 4.0)$ and $(4, 6.0)$ and $(6, 7.0)$ and $(8, 8.0).$
We can plot these data points:
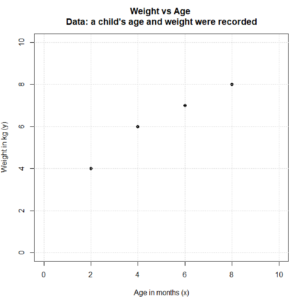
One of the reasons we like to plot $(x, y)$ data is because that lets us see what the data looks like. If you look at the above plot, it is easy to see that as this infant gets older, their weight increases.
Here is the R script I used to produce the above plot:
x = c(2, 4, 6, 8);
y = c(4.0, 6.0, 7.0, 8.0);
plot(x,y, xlim=c(0,10), ylim=c(0,10), xlab = "Age in months (x)", ylab = "Weight in kg (y)", main = "Weight vs Age \nData: a child's age and weight were recorded", pch = 16);
grid();
# End of Script
You can copy and paste the above R script into the free online R compiler at
https://rdrr.io/snippets/
For more information about using R please see my R webpage at:
https://mccarthymat150.commons.gc.cuny.edu/r/
When we plot points, like $(x, y)$ the convention is that the first coordinate (the $x$) tells you the horizontal position and the second coordinate (the $y$) tells you the point’s vertical position.
I’ve put the coordinates of the plotted points next to the points in the image below. Please make sure you understand how to plot points. It is very important for part of this course.

The linear equation y = mx + b.
The graph of the linear equation $y=mx+b$ is a straight line, so, we say “the line $y=mx+b$.”
If we graph the linear equation $y=mx +b$ the letter $m$ is the slope of that line and the letter $b$ is the y-intercept of that line.
The following example explains what we mean by the slope and y-intercept.
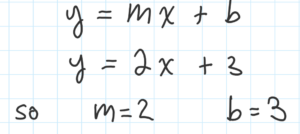
Example. For the equation $y = 2x + 3$ the slope $= m = 2$ and the y-intercept $= b = 3$.
Here is my graph of $y = 2x + 3$.

In the above picture, the graph of $y = 2x + 3$ is the straight line. The little arrows on the ends of the line indicate that the line goes on forever. The little black dots are the points that I used to graph the line. You really only need two points to graph a straight line, but I used 7 points. You can see that those 7 points are all on the same line.
How did I get those points?
I let $$x = -3, -2, -1, 0, 1, 2, 3$$ and I plugged those values of $x$ into the equation $y = 2x + 3$ to find the corresponding values of $y$. See the table below:
| x | y = 2x + 3 | y | (x, y) |
|---|---|---|---|
| -3 | y = 2(-3) + 3 | -3 | (-3, -3) |
| -2 | y = 2(-2) + 3 | -1 | (-2, -1) |
| -1 | y = 2(-1) + 3 | 1 | (-1, 1) |
| 0 | y = 2(0) + 3 | 3 | (0, 3) |
| 1 | y = 2(1) + 3 | 5 | (1, 5) |
| 2 | y = 2(2) + 3 | 7 | (2, 7) |
| 3 | y = 2(3) + 3 | 9 | (3, 9) |
The y-intercept $= b$. You can see that the graph of $y = 2x + 3$ (which is a straight line) intersects the y-axis at 3, or more precisely, at the point $(0, 3)$. This is why we call the $b$ in $y = mx + b$ the y-intercept.
The slope $= m$. The slope tells you how steep the graph of the line is and if, as you travel from left to right, whether the line goes up (positive slope) or down (negative slope). The formula for the slope is $$m = \frac{\Delta y}{\Delta x} = \frac{\text{change in } y}{\text{change in } x}$$ As the line goes from the point $(x_0, y_0)$ to the point $(x_1, y_1)$ the $$\text{change in $y$} = \Delta y = y_1 – y_0$$ and the $$\text{change in $x$} = \Delta x = x_1 – x_0$$ So, the formula for the slope becomes $$m = \frac{\Delta y}{\Delta x} = \frac{\text{change in } y}{\text{change in } x} = \frac{y_1 – y_0}{x_1 – x_0} $$
Please see Note 1. at the bottom of this page for a more advanced treatment of the slope formula.
We can find the slope of a line by picking any two points on that line and then using the slope formula. In the image below, I find the slope using the points $(1, 5)$ and $(3, 9)$ and then using the points $(1, 5)$ and $(2, 7)$. Both times I find that the slope is equal to $2$. Of course, the EASIEST way to find the slope of a linear equation $y = mx + b$ is just to remember that the $m$ is equal to the slope.

We can also find the slope of a line by looking at the line and “measuring” $\Delta y$ and $\Delta x$ as we travel from one point on the line to a second point on the line. The following three graphs visually explain this method.
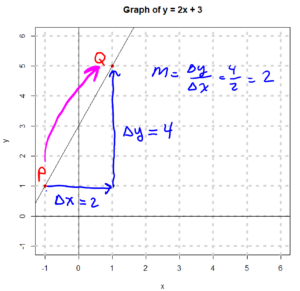
In the above graph, when we travel from the point P to the point Q we travel 2 units in the positive $x$ direction, meaning going from left to right, (so $\Delta x = 2$) and 4 units in the positive $y$ direction, meaning going upwards, (so $\Delta y = 4$). So: $$\text{slope} = m = \frac{\Delta y}{\Delta x} = \frac{4}{2} = 2$$
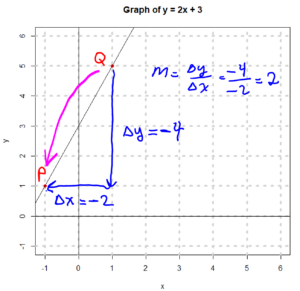
For the same graph, we could have also traveled from the point Q to the point P. We’d get the same result for the slope, however now we are traveling in the negative $x$ direction (right to left) and the negative $y$ direction (downwards). See image below.
Now, let’s look at a line with a negative slope: the line $y = -2x + 5.$ We know that the line $y = -2x + 5$ has a slope of $-2$ and a y-intercept of 5 (because of the -2 and the 5). However, let’s find the slope by measuring $\Delta x$ and $\Delta y$. See image below.
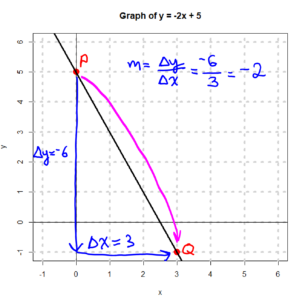
In the above graph, when we travel from the point P to the point Q we travel 6 units in the negative $y$ direction, meaning downwards, (so $\Delta y = -6$) and 3 units in the positive $x$ direction, meaning going left to right (so $\Delta x = 3$). So: $$\text{slope} = m = \frac{\Delta y}{\Delta x} = \frac{-6}{3} = -2$$
There are two special situations for slope.
1. Slope = zero. Horizontal line.
Suppose that $m = 0$ so that the linear equation $y = mx + b$ becomes $y = b$. That means that no matter what the value of $x$ is, the value of $y$ is $b$. So, the value of $y$ is constantly $b$, consequently $\Delta y = b – b = 0$. In other words: $$\text{slope} = \frac{\Delta y}{\Delta x} = \frac{0}{\Delta x} = 0$$ You can instantly recognize lines with zero slope by their graphs, which are horizontal lines, parallel to the x-axis.
Here is the graph of one such line, the line $y = 3$:

1. Slope = undefined. Vertical line.
Let $c$ be some constant. The line $x = c$ is the vertical line at $x = c$, The slope is undefined since $$\text{slope} = \frac{\Delta y}{\Delta x} = \frac{\Delta y}{0} = \text{undefined}$$ Note. Here $\Delta x = 0$ because $x = c$ no matter what $y$ is. So $x$ doesn’t change. So $\Delta x = 0.$ You can recognize the graphs of lines with undefined slope, since their graphs are vertical lines, parallel to the y-axis. Sometimes we say that vertical lines have infinite slope.
Here is the graph of one such line, the line $x = 3$:

The importance of slope to statistics.
Suppose we have $(x, y)$ data. For example, $x$ might be age and $y$ might weight.
If the data has a positive slope it means that:
as the value of $x$ increases, the value of $y$ also increases.
It also means that:
as the value of $x$ decreases, the value of $y$ decreases.
For this reason, when data has a positive slope we say that $x$ and $y$ move in the same direction.
Example for positive slope. As a child gets older their age $x$ increases and so does their weight $y$. So, if we plot a child’s (age, weight) data, we expect the data to have a positive slope.
If the data has a negative slope it means that:
as the value of $x$ increases, the value of $y$ decreases.
It also means that:
as the value of $x$ decreases, the value of $y$ increases.
For this reason, when data has a negative slope we say that $x$ and $y$ move in opposite directions.
Example for negative slope. Suppose we put a glass of water out in the sun. As time passes, the water will evaporate. If we let $x$ be the time and $y$ be the amount of water left in the glass, and we plot the (time, water left in glass) data the slope of the data points will be negative.
Notation for linear equations in statistics.
In statistics, instead of writing linear equations in the form $$y = mx + b$$ we write them in the form $$y = b_0 + b_1 x$$ All we have done is written $b_0$ for the y-intercept and $b_1$ for the slope (instead of $b$ and $m$).
Statisticians write $y = b_0 + b_1 x$ instead of $y = mx +b$ because the $b_i$ notation easily generalizes to polynomials like the parabola: $$y = b_0 + b_1 x + b_2 x^2$$
What are we graphing when we graph an equation?
When we graph an equation, for example the equation $$y = 2x + 3$$ we are plotting points $(x, y)$ that make the equation true. The points that make an equation true are called the equation’s solution set. So, when we graph an equation, we are graphing points in its solution set.
So, for example, $$(x, y) = (10, 23)$$ makes $y = 2x + 3$ true because if we put $(x, y) = (10, 23)$ into $y = 2x + 3$ we get $$(23) = 2(10) + 3$$ which is true.
On the other hand, $$(x, y) = (10, 24)$$ makes $y = 2x + 3$ false because if we put $(x, y) = (10, 24)$ into $y = 2x + 3$ we get $$(24) = 2(10) + 3$$ which is false.
So, when we say that the graph of a linear equation like $y = mx + b$ is a straight line, we mean that if we plot the points in its solution set, those points will form a straight line.
Functions. The concept of a function is important in all of mathematics. Functions have domains and ranges. A function is a rule which assigns to each member of the domain an object in the range. It sounds complicated, but it isn’t. The best way to understand about functions is to look at a few examples. Often, we don’t explicitly specify the domain or the range of a function.
Function Example 1. Let $f$ be the function which takes a number and multiplies it by 5. We’d write this function as $f(x) = 5x$. So, for example, $f(10) = 5(10) = 50.$
Function Example 2. Let $f$ be the function which takes a number and multiplies it by 2 and then adds 3. We’d write this function as $f(x) = 2x + 3$. So, for example, $f(10) = 2(10) + 3 = 23.$
Function Example 3. Let the domain be the students {Abe, Ben, Chris} and let the range be the flavors {chocolate, vanilla}. $f$ be the function which tells which of the two flavors the three students prefer. If Abe and Ben prefer vanilla and and Chris prefers chocolate we would write this as:
f(Abe) = vanilla
f(Ben) = vanilla
f(Chris) = chocolate
Note 1. On the definition of slope. It is more mathematical to first define the slope between two points to be given by the formula $$\text{slope} = \frac{\Delta y}{\Delta x} = \frac{y_1 – y_0}{x_1 – x_0} $$ and then to show that for the line $y = mx + b$ that the slope is $m$. Here is how you can do that. The formulas $y_0 = m x_0 + b$ and $y_1 = m x_1 + b$ define the points $(x_0, y_0)$ and $(x_1, y_1)$ on the line $y = mx + b$. The slope formula applied to those two points gives us: $$\begin{align}\text{slope} &= \frac{\Delta y}{\Delta x} = \frac{y_1 – y_0}{x_1 – x_0} = \frac{(m x_1 + b) – (m x_0 + b)}{x_1 – x_0} \\ \\ &= \frac{m (x_1 – x_0) + (b – b)}{x_1 – x_0} = \frac{m (x_1 – x_0) }{x_1 – x_0} \\ &= m \cdot \frac{x_1 – x_0}{x_1 – x_0} \\ &= m \end{align}$$