The following 5 videos (with a total run time of about 30 minutes) will help you with your Blackboard homework on this unit.
Please scroll down past these 5 videos for an in depth explanation of
Independence and the Binomial Distribution Formula
Q1.
Q2.
Q3.
Q4.
Q5.
Independence and the Binomial Distribution Formula
Note. If the mathematics on this page does not display properly on your cell phone, try viewing it in landscape mode, or better yet, view this page on a computer.
Some questions, towards the bottom of the page, include R scripts.
In particular, see Question 9 for instructions on how to use R.
There are two videos for this unit.
Scroll down to the bottom of this page for the videos.
Independence
We say two properties are independent if having one of the properties does not effect the probability of having the other property.
Example 1. Having shoe size 9 and having a GPA above 3.0 are independent properties because if someone has a shoe size 9 it doesn’t make them more or less likely to have a GPA above 3.0 than other students.
Example 2. Having a GPA above 3.0 and getting an A in statistics are not independent properties because if someone has a GPA above 3.0 they are more likely to get an A in statistics than other students.
Example 3. Having a GPA below 1.0 and getting an A in statistics are not independent properties because if someone has a GPA below 1.0 they are less likely to get an A in statistics than other students.
Example 4. We toss a coin twice. Getting heads on the first toss is independent of getting heads on the second toss because what happens on the first toss does not effect what happens on the second toss. The coin doesn’t remember the first toss!
Deciding on whether properties are independent is of great importance in all aspects of life.
Example 5. We study for exams because studying for an exam and doing well on the exam are not independent. If you study for an exam the probability of you doing well on the exam increases.
Example 6. We tend not to worry about the color of the clothes we wear during an exam because clothing color and doing well on an exam are independent of each other.
Example 7. If we realize that a certain food makes us feel sick we (should) stop eating that food because eating that food and feeling sick are not independent.
Example 8. Smoking and lung disease are not independent. Smoking increases the likelihood of lung disease.
Example 9. Living in an environment with clean, fresh air and lung disease are not independent. Clean air decreases the likelihood of lung disease.
Example 10. “Favorite color is blue” and “favorite flavor is chocolate” are independent properties because if someone’s favorite color is blue it doesn’t make them more or less likely to have chocolate as their favorite flavor.
Independent Events
Mathematical Definition of Independent Events. Let S be the set of all possible outcomes for some process. Let A and B be subsets (events) contained in S. We say A and B are independent if:
$$ P(A \cap B) = P(A) P(B) $$
Why does the above definition of independent events make sense?
For concreteness, I’ll use Example 10 to explain why the mathematical definition of independent events makes sense.
Example 10 continued. “Favorite color is blue” and “favorite flavor is chocolate” are independent properties because if someone’s favorite color is blue it doesn’t make them more or less likely than any other person to have chocolate as their favorite flavor.
It turns out that about 25% of people have blue as their favorite color and about 40% of people have chocolate as their favorite flavor 1.
Let:
S = all the people in the world
A = people whose favorite color is blue.
B = people whose favorite flavor is chocolate.
$$ P(A) = \dfrac{|A|}{|S|} = 25\%$$
$$ P(B) = \dfrac{|B|}{|S|} = 40\%$$
$P(A \cap B)$ is the probability of a person having favorite color blue and favorite flavor chocolate.
Since favorite color and flavor are independent, having blue as their favorite color doesn’t make a person any more or any less likely to have chocolate as their favorite flavor. So, if we just consider people whose favorite color is blue, 40% of them will have chocolate as their favorite flavor. So, 25% of people have favorite color blue and 40% of them also have chocolate as their favorite flavor.
$ P(A \cap B) = 40\% \text{ of } 25\% $
$= 25\% \times 40\% = P(A) P(B) $
which agrees with the definition of A and B being independent given above.
Bernoulli (Binomial) Processes
Question 1. Suppose we have a bag with 2 green and 3 red marbles in it. If we sample twice with replacement what is the probability we get a green and then a red marble? I.e., what is P(GR)? See Figure below.

Sampling with replacement means we put the marble back in the bag after pulling it out.
Sampling without replacement means we don’t put the marble back in the bag.
Answer to Question 1.
$$P(GR) = P(G) P(R) = \dfrac{2}{5} \ \dfrac{3}{5} = \dfrac{6}{25}$$
Explanation of answer. The set of all possible outcomes for this process is
S = {GG, GR, RG, RR}
We want to know the probability of getting a green and then a red marble: P(GR).
Let:
A = first marble is green
B = second marble is red
Since we are sampling with replacement, each time we sample (pull a marble from the bag and record its color) the probability of getting a green marble is always:
$$P(G) = \dfrac{2}{5}$$
and the probability of getting red marble is always
$$P(R) = \dfrac{3}{5}$$
In particular:
$P(A) = P(G) = \dfrac{2}{5}$
$P(B) = P(R) = \dfrac{3}{5}$
Since we are sampling with replacement A and B are independent, meaning that the color of the first marble has no effect on the probability of the color of the second marble. So:
$P(GR) = P(A \cap B) = P(A) P(B) $
$= P(G) P(R) = \dfrac{2}{5} \ \dfrac{3}{5}$
$= \dfrac{6}{25}$
Question 2. Suppose we have a bag with 2 green and 3 red marbles in it, like in Question 1. If we sample six times with replacement find P(G R R G G G).
Answer to Question 2.
$P(G R R G G G) = $
$P(G) \ P(R)\ P(R) \ P(G) \ P(G) \ P(G) $
$ = \left(\dfrac{2}{5}\right) \ \left(\dfrac{3}{5}\right) \ \left(\dfrac{3}{5}\right) \ \left(\dfrac{2}{5}\right) \ \left(\dfrac{2}{5}\right) \ \left(\dfrac{2}{5}\right)$
$= \dfrac{104}{15625} = 0.009216$
Important simplification. We just have to count how many G’s we want (4) and how many R’s we want (2) since:
$P(G R R G G G) $
$= P(G) \ P(R)\ P(R) \ P(G) \ P(G) \ P(G) $
$ = P(G)^4 \ P(R)^2$
$= \left(\dfrac{2}{5}\right)^4 \left(\dfrac{3}{5}\right)^2 = 0.009216$
Note that $0.009216 = 0.9216\%$, which is a little less than 1%.
Question 3. Suppose we have a bag with 2 green and 3 red marbles in it, like in Question 1. If we sample 8 times with replacement find P(G R R R R R R G), which is G followed by 6 R and then a G.
Answer to Question 3.
$P(G R R R R R R G) = P(G)^2 \ P(R)^6 $
$= \left(\dfrac{2}{5}\right)^2 \left(\dfrac{3}{5}\right)^6 = 0.00746496$
How to do the calculation for Question 3 in R.

Here are the R commands to do Question 3:
G = 2/5; R = 3/5;G^2 * R^6;
R returns the answer
0.00746496
Developing the Binomial Distribution Formula
Question 4. Suppose we have a bag with 2 green and 3 red marbles in it, like in Question 1. We sample 3 times with replacement and we let X be the random variable that counts how many green marbles we get in our sample. So, for example, X(RGR) = 1 because in the outcome RGR there is 1 green marbles. Find the probability that we get 1 green marble. In other words, find P(X = 1).
Answer to Question 4.
The only outcomes for which X = 1 at the outcomes GRR, RGR, RRG. So:
$P(X = 1) = P(GRR, RGR, RRG) $
$= P(GRR) + P(RGR) + P(RRG)$
$= 3 P(G)^1 P(R)^2$
$= 3 \left( \dfrac{2}{5} \right)^1 \left( \dfrac{3}{5} \right)^2$
$ = 0.432$
Question 5. Suppose we have a bag with 2 green and 3 red marbles in it, like in Question 1. We sample 9 times with replacement and we let X be the random variable that counts how many green marbles we get in our sample. Find the probability that we get 4 green marbles. In other words, find P(X = 4).
Answer to Question 5.
$P(X = 4) $
$ = \text{(how many outcomes have 4 green marbles)} \times P(G)^4 P(R)^5$
Note. The exponent of P(R) is 5 because the sample size is n = 9 and if 4 of the marbles in the sample are green then the other 5 marbles in the sample have to be red because 4 + 5 = 9.
(how many outcomes have 4 green marbles) = 9C4 = 126
Here we are using nCr with n = 9 and r = 4 to get 9C4. See Figure below for an explanation.

So, we get:
$P(X = 4) = 9C4\ P(G)^4 P(R)^5$
$= \dfrac{(9)(8)(7)(6) }{4)(3)(2)(1)} \left(\dfrac{2 }{5}\right)^4 \left(\dfrac{3 }{5}\right)^5 $
$= 0.2508227$
We can do this calculation in R as follows (see Figure below):

Here are the R commands to do Question 5:
choose(9,4) * (2/5)^4 * (3/5)^5
Binomial Distribution Formula
Sampling with replacement from a bag with colored marbles is an example of a Bernoulli Process.
A Bernoulli Process consists of n independent trials or steps, each of which is identical and has only two outcomes: success or failure. For example, a green or red marble, heads or tails, male or female, likes or doesn’t like chocolate, improves or doesn’t improve, and so on.
Binomial Distribution Formula. Let X be the random variable that counts how many successes occur in a n step Bernoulli Process. Then
$$P(X = r) = nCr \ P(\text{success})^r \ P(\text{failure})^{n-r}$$
We can write the Binomial Distribution Formula more compactly by letting
$$ \rho = P(\text{success})$$
Then, since there are only two outcomes at each step, we must have
$$P(\text{failure}) = 1 – \rho$$
In other words,
$$P(\text{success}) + P(\text{failure}) = 1$$
With these substitutions the Binomial Distribution Formula becomes:
$$P(X = r) = nCr \ \rho^r \ (1 – \rho)^{n-r}$$
Question 6. Suppose we have a bag with 2 green and 3 red marbles in it, like in Question 1. We sample 9 times with replacement and we let X be the random variable that counts how many green marbles we get in our sample. Find the probability that we get 3 green marbles. In other words, find P(X = 3).
Answer to Question 6.
X is binomial with n = 9, r = 3, X counts green marbles in our samples, so $\rho = P(G) = \dfrac{2}{5}$. Using the Binomial Distribution Formula we get
$$P(X = r) = nCr \ \rho^r \ (1 – \rho)^{n-r}$$
$$P(X = 3) = 9C3 \ \left(\dfrac{2}{5}\right)^3 \ \left(1 – \dfrac{2}{5}\right)^{9-3}$$
$$P(X = 3) = \dfrac{(9)(8)(7)}{(3)(2)(1)} \ \left(\dfrac{2}{5}\right)^3 \ \left(\dfrac{3}{5}\right)^{6} = 0.2508227$$
We can do Question 6 in R two ways.
Method 1. By doing the binomial distribution formula directly in R:
choose(9,3) * (2/5)^3 * (3/5)^6
Method 2. Using R’s built in binomial distribution function dbinom.
# Binomial Dist P(X=r)
n = 9;
p = 2/5;
r = 3;
dbinom(r, n, p);  # make sure to keep the order: r, n,
Picturing the binomial distribution
Suppose $x$ is binomally distributed with $n = 2$ and $\rho = 1/2$, like if we toss a fair coin twice and have $x$ count heads. The distribution of $x$ is
$P(x = 0) = 0.25$
$P(x = 1) = 0.50$
$P(x = 2) = 0.25$
$P(x = \text{anything else}) = 0$
Here is the most accurate way to draw the distribution of $x$:

It is accurate because it shows that the only values for which the $x$ has non zero probability are $x = 0, 1, 2$.
Here is another way we can draw the distribution of $x$. It is a little bit misleading because it seems to indicate that $x$ can be between 0 and 1, or between 1 and 2, with non-zero probability.

Even though the above Figure is a little bit misleading, it is an example of how we’ll draw binomial distributions, as barplots.
Why do we prefer barplots? For one, they are prettier. But the main reason is because they look like probability density functions (PDF’s), which is how statisticians tend to visualize distributions. In a PDF the area (of the bar) corresponds to probability.
For example, in the above Figure, consider the purple bar above $x = 2$.
$P(x = 2) = $ area of the purple bar.
$P(x = 2) = $ height $\times$ width
$P(x = 2) = 0.25 \times 1 = 0.25$
Drawing the binomial distribution for Question 6.
The following Figure is the probability density barplot corresponding to the binomial distribution used to solve Question 6. Since the widths of the bars are all 1, the probability density and the probability are numerically equivalent. Notice the that the distribution is shaped like a hill.

The following R script created the above barplot:
#Binomial Distribution Bar Plot P(X = single value)
n = 9;
p = 2/5;
X = 3;
data = dbinom(x=0:n,size=n, prob=p)
names(data) = 0:n
cols = rep("grey", n + 1)
cols[X + 1] = "red"
TotalProb = dbinom(x= X,size=n, prob=p)
TotalProbSig = signif(TotalProb, 4)  # use 3 significant digits
titleString = paste("Probability Density Barplot: Binomial Distribution n =" ,n, ", p = ", p,
  "\n P(X = ", X, ") = ", TotalProbSig , "shown in red");
barplot(data, col = cols, main = titleString , xlab = "X", ylab = "probability density");
# End of Script
Question 7. Suppose we have a bag with 2,000 green and 3,000 red marbles in it. We sample 9 times without replacement and we let X be the random variable that counts how many green marbles we get in our sample. Find the probability that we get 7 green marbles. In other words, find P(X = 7).
Answer to Question 7.
Strictly speaking, this is not Bernoulli, because we are sampling without replacement. So, as we sample, the number of marbles in the bag changes. Consequently, the steps are not independent: the outcome of one step effects the probabilities of the following steps.
However, there is such a large number of marbles in the bag, and we are only sampling 9 times, so the effect of sampling without replacement is very weak 2.
So, this process is approximately Bernoulli. In other words, we can use the Binomial Distribution Formula to get an answer that will be very close to the true answer, which is good enough.
X is (approximately) binomial with n = 9, r = 7, X counts green marbles in our samples, so $\rho = P(G) = \dfrac{2,000}{5,000} = \dfrac{2}{5}$. Using the Binomial Distribution Formula we get
$$P(X = r) = nCr \ \rho^r \ (1 – \rho)^{n-r}$$
$$P(X = 7) = 9C7 \ \left(\dfrac{2}{5}\right)^7 \ \left(1 – \dfrac{2}{5}\right)^{9-7}$$
Note. By the complement principle 9C7 = 9C2.
$$P(X = 7) = \dfrac{(9)(8)}{(2)(1)} \ \left(\dfrac{2}{5}\right)^7 \ \left(\dfrac{3}{5}\right)^{2} = 0.02123366$$
How to do this calculation in R.

Copy and paste:
n = 9;
r = 7;
p = 2/5;
choose(n,r) * p^r * (1-p)^(n-r);   # method 1
dbinom(r,n,p)                      # method 2
into R. R returns the answer:
0.02123366
Here is the probability density barplot corresponding to Question 7:

Question 8. Suppose that chocolate is the favorite flavor of 40% of all people. If we have a sample of 10 people, what is the probability that 4 of them will have chocolate as their favorite flavor? Let X be the random variable that counts how many of the people in our sample have chocolate as their favorite flavor. So, in other words, find P(X = 4).
Answer to Question 8.
This is (approximately) Bernoulli with n = 10, r = 4, X counts how many have chocolate as their favorite flavor in our samples. So $\rho = 40\% = 0.40$. Using the Binomial Distribution Formula we get
$$P(X = r) = nCr \ \rho^r \ (1 – \rho)^{n-r}$$
$$P(X = 4) = 10C4 \ \left(0.40\right)^4 \ \left(1 – 0.40\right)^{10-4}$$
$$P(X = 4) = \dfrac{(10)(9)(8)(7)}{(4)(3)(2)(1)} \ \left(0.40\right)^4 \ \left(0.60\right)^{6} = 0.2508227$$
How to do this calculation in R.
Copy and paste:
n = 10;
r = 4;
p = 0.40
choose(n,r) * p^r * (1-p)^(n-r) ;
into R. R returns the answer:
0.2508227
Here is the probability density barplot corresponding to Question 8:

Question 9. Suppose that vanilla is the favorite flavor of 60% of all people. If we have a sample of 12 people, what is the probability that at least 10 of them will have vanilla as their favorite flavor? Let X be the random variable that counts how many of the people in our sample have vanilla as their favorite flavor. So, in other words, find $P(X \geq 10)$.
Note.
The $\geq$ sign means “greater than or equal to”.
The $\leq$ sign means “less than or equal to”.
Answer to Question 9.
$P(X \geq 10) = P(X = 10) + P(X = 11) + P(X = 12)$
There are billions of people on earth, so this is (approximately) Bernoulli with n = 12, r = 10, 11, 12, X counts how many have vanilla as their favorite flavor in our samples. So $\rho = 60\% = 0.60$. Using the Binomial Distribution Formula we get
$$P(X = r) = nCr \ \rho^r \ (1 – \rho)^{n-r}$$
$P(X = 10 ) = 12C10 \ \left(0.60\right)^10 \ \left(1 – 0.60\right)^{12-10}$
$P(X = 11 ) = 12C11 \ \left(0.60\right)^11 \ \left(1 – 0.60\right)^{12-11}$
$P(X = 12 ) = 12C12 \ \left(0.60\right)^12 \ \left(1 – 0.60\right)^{12-12}$
which simplifies to
$P(X = 10 ) = 12C10 \ \left(0.60\right)^10 \ \left( 0.40\right)^{2}$
$P(X = 11 ) = 12C11 \ \left(0.60\right)^11 \ \left(0.40\right)^{1}$
$P(X = 12 ) = 12C12 \ \left(0.60\right)^12 \ \left(0.40\right)^{0}$
We can further simplify the above using the complement principle:
$12C10 = 12C2 = \dfrac{(12)(11)}{(2)(1)} = 66$
$12C11 = 12C1 = \dfrac{(12)}{(1)} = 12$
$12C12 =12C0 = 1$
Note. nC0 = 1 because there is only one subset of size 0 in a set of size n, namely the empty set.
So, we get:
$P(X = 10 ) = \dfrac{(12)(11)}{(2)(1)} \ \left(0.60\right)^10 \ \left( 0.40\right)^{2} = 0.06385228$
$P(X = 11 ) = \dfrac{(12)}{(1)} \ \left(0.60\right)^11 \ \left(0.40\right)^{1} = 0.01741426$
$P(X = 12 ) = (1) \ \left(0.60\right)^12 \ \left(0.40\right)^{0} = 0.002176782$
So,
$P(X \geq 10) = P(X = 10) + P(X =11) + P(X = 12)$
$= 0.06385228 + 0.01741426 + 0.002176782$
$ = 0.08344332$.
How to do this calculation in R.
In R open up a “New script” by going to the menu: File, New Script.
R should launch a window that says “R Editor”.
See Figure below.
Copy and paste the following R script into the “R Editor” window in R:
#Binomial Distribution P(X = 10, 11, 12)
r = 10:12 # r = 10, 11, 12
n = 12
p = .60
sum(choose(n,r)* p^r * (1-p)^(n-r))
It should look like this:

R returns the answer:
0.08344332
We could also use R’s built in binomial distribution function, dbinom, in which case, the above script would become:
#Binomial Distribution P(X = 10, 11, 12)
r = 10:12 # r = 10, 11, 12
n = 12
p = .60
sum(dbinom(r,n,p)
Note about #. The symbol # tells R that everything to the right of the # is a comment and should not be compiled. So, you can use the # to make comments in your script.
Note about R’s colon operator: In the above script we have the line:
r = 10 : 12
the colon : between the 10 and the 12 tells are to make the sequence 10, 11, 12
To run the R script. Make sure the “R Editor” window is active (i.e., click on it).
Then, go to the R menu and select Edit, Run all.
See Figure below.

You should probably save the R script you created.
This way you don’t have to retype it again and again.
Save the script with extension .R
Note. Clicking on a saved R script often won’t open it R.
If you want to open the script in R you should open it from inside of R.
Just go to the R menu, choose File, Open Script.
Here is the probability density barplot of the binomial distribution we used to solve Question 9:

Here is the R script used to create the above probability density barplot.
# Binomial Distribution P(X = r_start to r_end)
n = 12 ;
p = 0.60 ;
r_start = 10 ;
r_end = 12 ;
data = dbinom(x=0:n,size=n, prob=p);
names(data) = 0:n;
cols = rep("grey", n + 1);
cols[(r_start + 1): (r_end + 1) ] = "red";
TotalProb = sum(dbinom(x= r_start:r_end,size=n, prob=p));
TotalProbSig = signif(TotalProb, 4);  # use 3 significant digits
titleString = paste("Probability Density Barplot: Binomial Distribution n =" ,n, ", p = ", p,
  "\n P(X = ", r_start, " to ", r_end, ") = ", TotalProbSig , "shown in red");
barplot(data, col = cols, main = titleString , xlab = "X", ylab = "probability density");
# End of script
Question 10. Suppose that vanilla is the favorite flavor of 60% of all people. If we have a sample of 12 people, what is the probability that 4 or less of them will have vanilla as their favorite flavor? Let X be the random variable that counts how many of the people in our sample have vanilla as their favorite flavor. So, in other words, find $P(X \leq 4)$.
Answer to Question 10. This is (approximately) Bernoulli with n = 12, r = 0, 1, 2, 3, 4; X counts how many have vanilla as their favorite flavor in our samples. So $\rho = 60\% = 0.60$. We use the Binomial Distribution Formula:
$$P(X = r) = nCr \ \rho^r \ (1 – \rho)^{n-r}$$
and we use
$P(X \leq 4)$
$= P(X=0) + P(X=1) + P(X=2) + P(X=3) + P(X = 4)$
we calculate:
$P(X = 0 ) = 12C0 \ \left(0.60\right)^0 \ \left(1 – 0.60\right)^{12- 0}$
$P(X = 1 ) = 12C1 \ \left(0.60\right)^1 \ \left(1 – 0.60\right)^{12-1}$
$P(X = 2 ) = 12C2 \ \left(0.60\right)^2 \ \left(1 – 0.60\right)^{12-2}$
$P(X = 3 ) = 12C3 \ \left(0.60\right)^3 \ \left(1 – 0.60\right)^{12-3}$
$P(X = 4 ) = 12C4 \ \left(0.60\right)^4 \ \left(1 – 0.60\right)^{12-4}$
which we can quickly do in R using the following script 3.
#Binomial Distribution P(X = 0, 1, 2, 3, 4)
r = 0:4 # r = 0, 1, 2, 3, 4
n = 12
p = .60
sum(choose(n,r)* p^r * (1-p)^(n-r))
After running the above script in R, we get the answer:
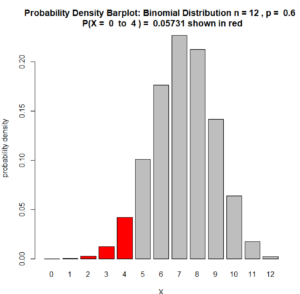
$$P(X \leq 4) = 0.05730992$$
Here is the probability density barplot of the binomial distribution we used to solve Question 10:
Question 11. Suppose that 65% of people like to watch parades. If we have a sample of 100 people, what is the probability that between 60 and 70 of them like to watch parades? Let X be the random variable that counts how many of the people in our sample like to watch parades. So, in other words, find $P(60 \leq X \leq 70)$.
Answer to Question 11. This is (approximately) Bernoulli with n = 100, r = 60, 61, …, 69, 70; X counts how many people in our sample like to watch parades. So $\rho = 65\% = 0.65$. We use the Binomial Distribution Formula:
$$P(X = r) = nCr \ \rho^r \ (1 – \rho)^{n-r}$$
and
$ P(60 \leq X \leq 70)$
$= P(X = 60) + P(X = 61) + \cdots + P(X = 69) + P(X=70)$
It is best to do this calculation in R.
#Binomial Distribution P(X = 60, 61, ... , 70)
r = 60:70 # r = 60, 61, ..., 70
n = 100
p = .65
sum(choose(n,r)* p^r * (1-p)^(n-r))
or, using R’s dbinom function:
#Binomial Distribution P(X = 60, 61, ... , 70)
r = 60:70 # r = 60, 61, ..., 70
n = 100
p = .65
sum(dbinom(r,n,p))
Either way, R gives us the answer.
$$P(60 \leq X \leq 70) = 0.7513791$$
Here is the probability density barplot of the binomial distribution we used to solve Question 11:

There are two videos for this unit
Video 1. Basic Binomial Distribution Question (5:59)
Question: Suppose 60% of students have laptop computers. In a sample of 10 students what is the probability that 6 of them will have laptops.
Answer:
$P(X = 6) = 10C6 \, (60\%)^6 \, (40\%)^4 = .2508$
See video:
Video 2. More Advanced Binomial Distribution Question (5:33)
Question: Suppose 45% of people like apples. Find the probability that in a sample of 8 people that 2 or less of them like apples.
Answer:
$P(X \leq 2) = P(X = 0) + P(X=1) + P(X=2) $
$ = 8C0 \, (45\%)^0 \, (55\%)^8$
$ + \, 8C1 \, (45\%)^1 \, (55\%)^7$
$ + \, 8C2 \, (45\%)^2 \, (55\%)^6$
$ = .00837 + .05481 + .15694$
$ = .22013$
See video:
Footnotes:
- These percents: 25% and 40% are just quick approximations. They are based on various sources I found online and from surveys I’ve given my students.
- We can see this by considering the following. The probability that the first marble is green is $\dfrac{2,000}{5,000} = \dfrac{2}{5} = 0.4$. Now, suppose the first marble we get is green, what is the probability that the second marble will also be green? That’s easy. We are sampling without replacement so we have one less green marble. So, we get $\dfrac{1,999}{4,999} = 0.39988 \approx = 0.4$.
- See the answer to Question 9 for details on using a similar R script.